
A step by step cookbook on best practices for alerting on Kubernetes platform and orchestration, including PromQL alerts examples.
If you are new to Kubernetes and monitoring, we recommend that you first read Monitoring Kubernetes in production, in which we cover monitoring fundamentals and open-source tools.
Interested in Kubernetes monitoring?
Check these other articles with advanced topics:
· troubleshooting Kubernetes service discovery via system captures →
· monitoring Kubernetes at WayBlazer (a use case) →

Effective alerting is at the bedrock of a monitoring strategy. Naturally, with the shift to orchestrated container environments and Kubernetes, your alerting strategy will need to evolve as well.
This is due to a few core reasons, many of which we covered in how to monitor kubernetes:
New infrastructure layers: Between your services and the host, now you have a new layer: the containers and the container orchestrator. These are new internal services that you need to monitor, and your alerting system needs to be aware of them.
Microservices architecture: Containers are not coupled with Kubernetes nodes like services were before, so traditional monitoring doesn’t work effectively. There is no static number of service instances running (think of a canary deployment or auto-scaling setup). It’s fine that a process is being killed in one node because, chances are, it is being rescheduled somewhere else in your infrastructure.
New scale and aggregation requirements: With services spread across multiple containers, monitoring system level and service specific metrics for all of those, plus all of the new services that Kubernetes brings in, can your monitoring and alerting system ingest all of these metrics at a large scale? You also need to look at the metrics from different perspectives. If we automatically tag metrics with the different labels existing in Kubernetes and our monitoring system understands Kubernetes metadata, we can aggregate or segment metrics as required in each situation.
Lack of visibility: Containers are black boxes. Traditional tools can only check against public monitoring endpoints. If you want to deeply monitor the service in question, you need to be able to look at what’s happening inside the containers.
With these issues in mind, let’s go through best practices alerting on Kubernetes environments. Our Kubernetes alerts tutorial will cover the following:
- General alerting basics
- Alerting on the host or Kubernetes node layer
- Alerting on the Kubernetes infrastructure
- Alerting on services running on Kubernetes
- Alerting on application layer metrics
General alerting on Kubernetes basics
Let’s first settle a set of basic rules that we want to follow when we’re alerting in order to improve the efficiency and mental health of your on-call rotation.
- Alerts should be based on symptoms. If an unexpected value in a metric doesn’t have any appreciable impact, it shouldn’t be an alert. You can check those values and generate maintenance tasks, but don’t wake anybody up in the middle of the night!
- Alerts should be actionable. Triggering an alert with nothing to do about it will only generate frustration.
- There are several methodologies like Golden Signals that allow a standardization of the way you alert, making the dashboards and alerts much easier to understand.
Alerting on the host or Kubernetes node layer
Alerting at the host layer shouldn’t be very different from monitoring cloud instances, VMs or bare metal servers. It’s going to be mostly about if the host is up or down/unreachable, and resources availability (CPU, memory, disk, etc.).
The main difference is the severity of the alerts now. Before, a system down likely meant you had an application down and an incident to handle (barring effective high availability). With Kubernetes, services are now ready to move across hosts and host alerts should never wake you up from bed, as long as you have enough of them to run your apps. You only need to be sure that the dead host has been replaced by a new one as it should be.
Let’s see a couple of options that we should still consider:
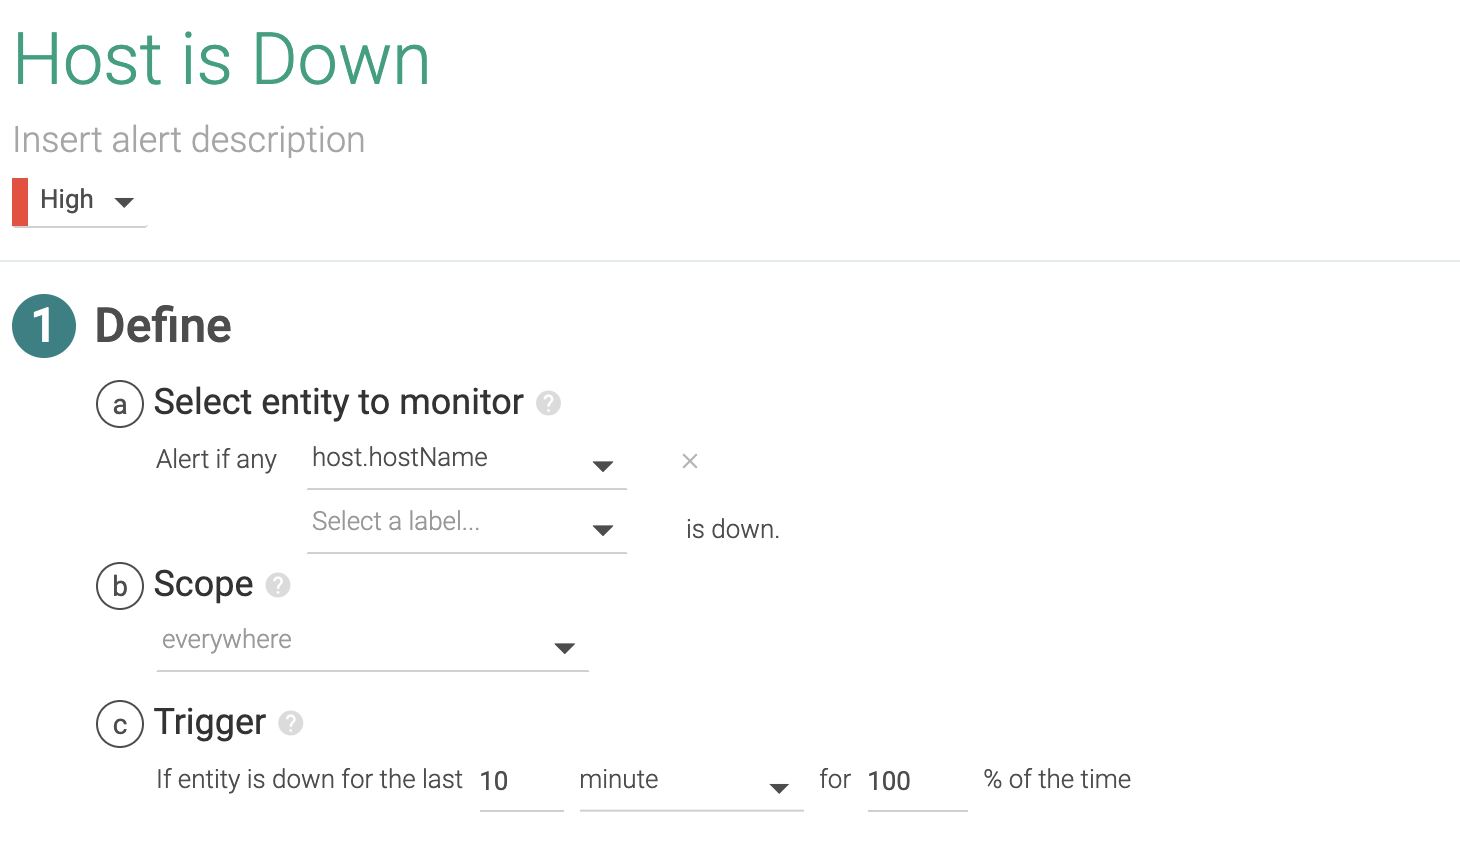
1.1 Host is down
If a host is down or unreachable, we might want to receive a notification. We will apply this single alert across our entire infrastructure. We’re going to give it a five minutes wait time in our case, since we don’t want to see noisy alerts on network connectivity hiccups. You might want to lower that down to one or two minutes depending on how quickly you wish to receive a notification, but you risk flapping notifications on it (up and down too often).
Later in this document, we will see that as we have another layer in the orchestration that acts as a high availability system, one node failing is not of extreme importance. Anyway, we have to monitor the number of nodes remaining, referenced to the load we are running, so we can ensure the active nodes can handle the load. In addition we should be aware of the moment when the failure of another node would provoke a shortage of resources to run all of the workloads.
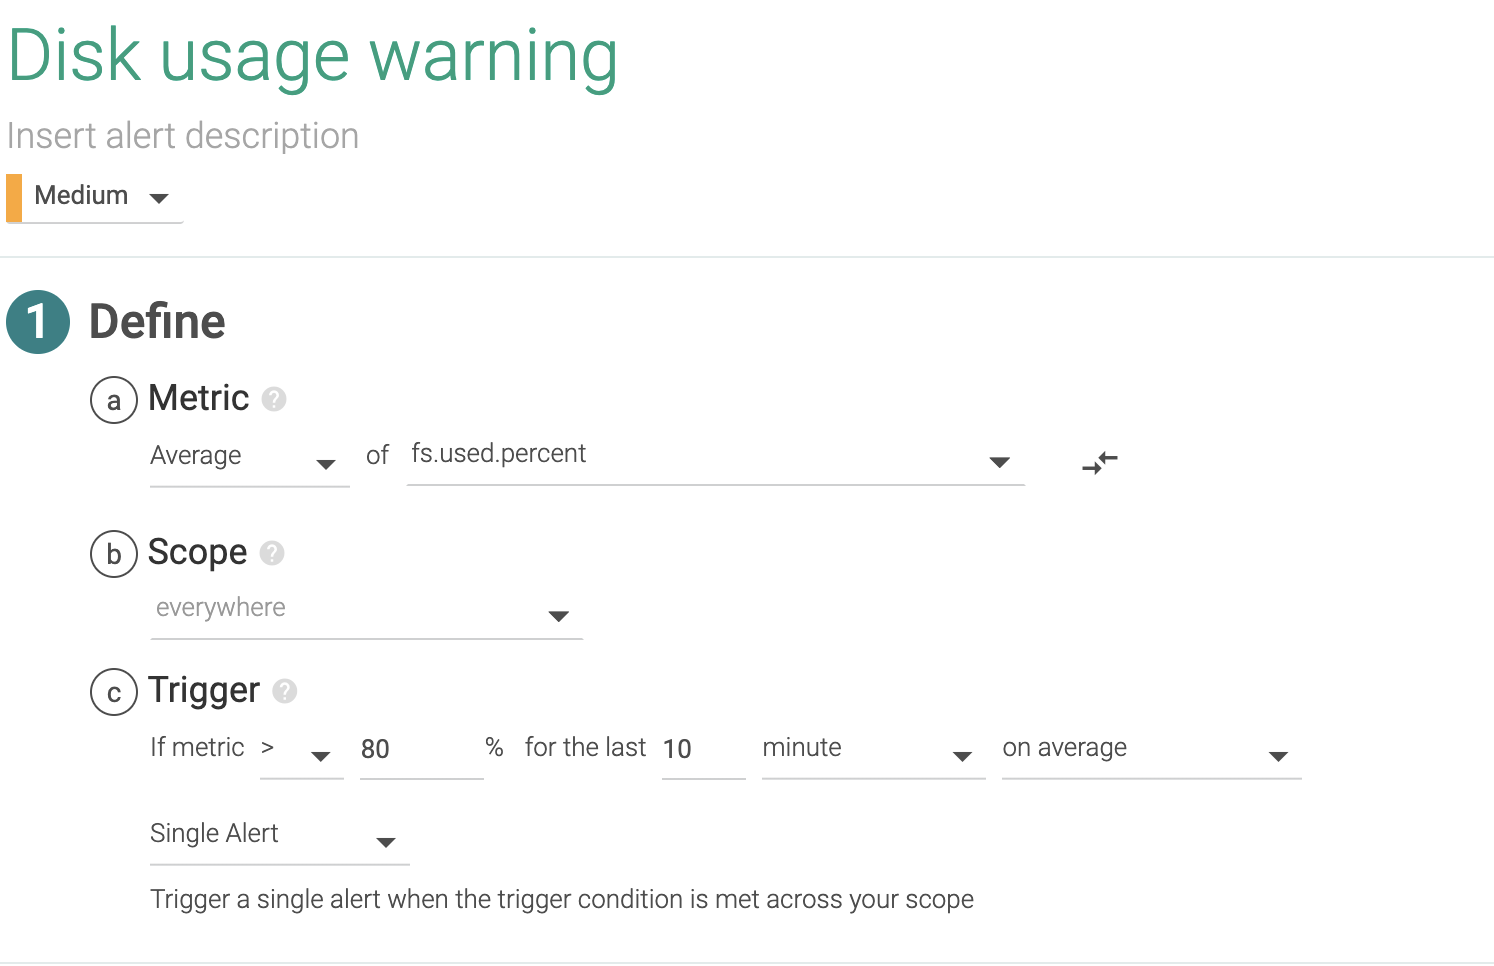
1.2 Disk usage
This is a slightly more complex alert. We can apply this alert across all file systems of our entire infrastructure. We manage to do that setting everywhere as scope and firing a separate evaluation/alert per mount (in Sysdig fs.mountDir).
This is a generic alert that triggers over 80% usage but you might want different policies, like a second higher priority alert with a higher threshold like 95%, or different thresholds depending on the file system.
If you want to create different thresholds for different services or hosts, simply change the scope to where you wish to apply a particular threshold.
If we need more advanced disk alerts, PromQL has additional functions that allow us to do linear predictions and see how fast the disk is filling at the current rate.
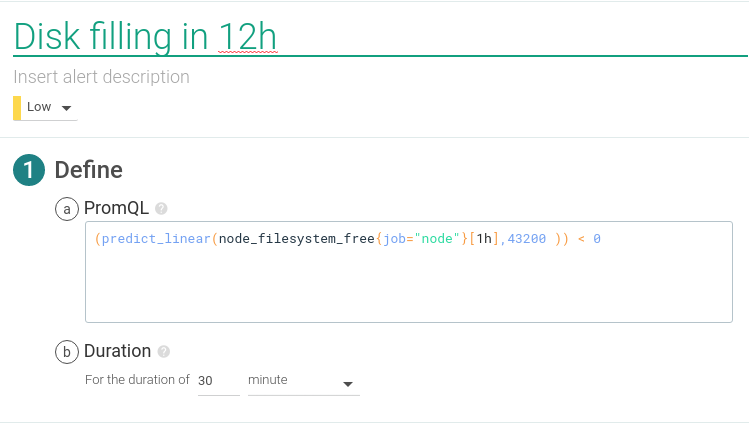
PromQL query:
(predict_linear(node_filesystem_free{job="node"}[1h],43200 )) < 0
This alert will trigger in case the disk was going to be full in the next 12 hours at current speed.
1.3 Some other resources
Usual suspects in this category are alerts on load, CPU usage, memory and swap usage. You probably want to send a notification, but not to wake anyone up, if any of these is significantly high during a prolonged time frame. A compromise needs to be found between the threshold, the wait time and how noisy can your alerting system become with no actionable alerts.
If you still want to set up metrics for these resources, look at the following metrics names on Sysdig Monitor:
- For load: load.average.1m, load.average.5m and load.average.15m
- For CPU: cpu.used.percent
- For memory: memory.used.percent or memory.bytes.used
- For swap: memory.swap.used.percent or memory.swap.bytes.used
In this category, some people also include monitoring the cloud provider resources that are part of their infrastructure.
Alerting on the Kubernetes infrastructure
Monitoring and alerting at the container orchestration level is two-fold. On one side, we need to monitor if the services handled by Kubernetes meet the requirements we defined. On the other side, we need to make sure all of the components of Kubernetes are up and running.
2.1 Is Kubernetes etcd running?
etcd is the distributed service discovery, communication command channel for Kubernetes. Monitoring etcd can go as deep as monitoring a distributed key value database but we’ll keep things simple here. etcd works if more than half of the configured instances are running, so let’s alert this.
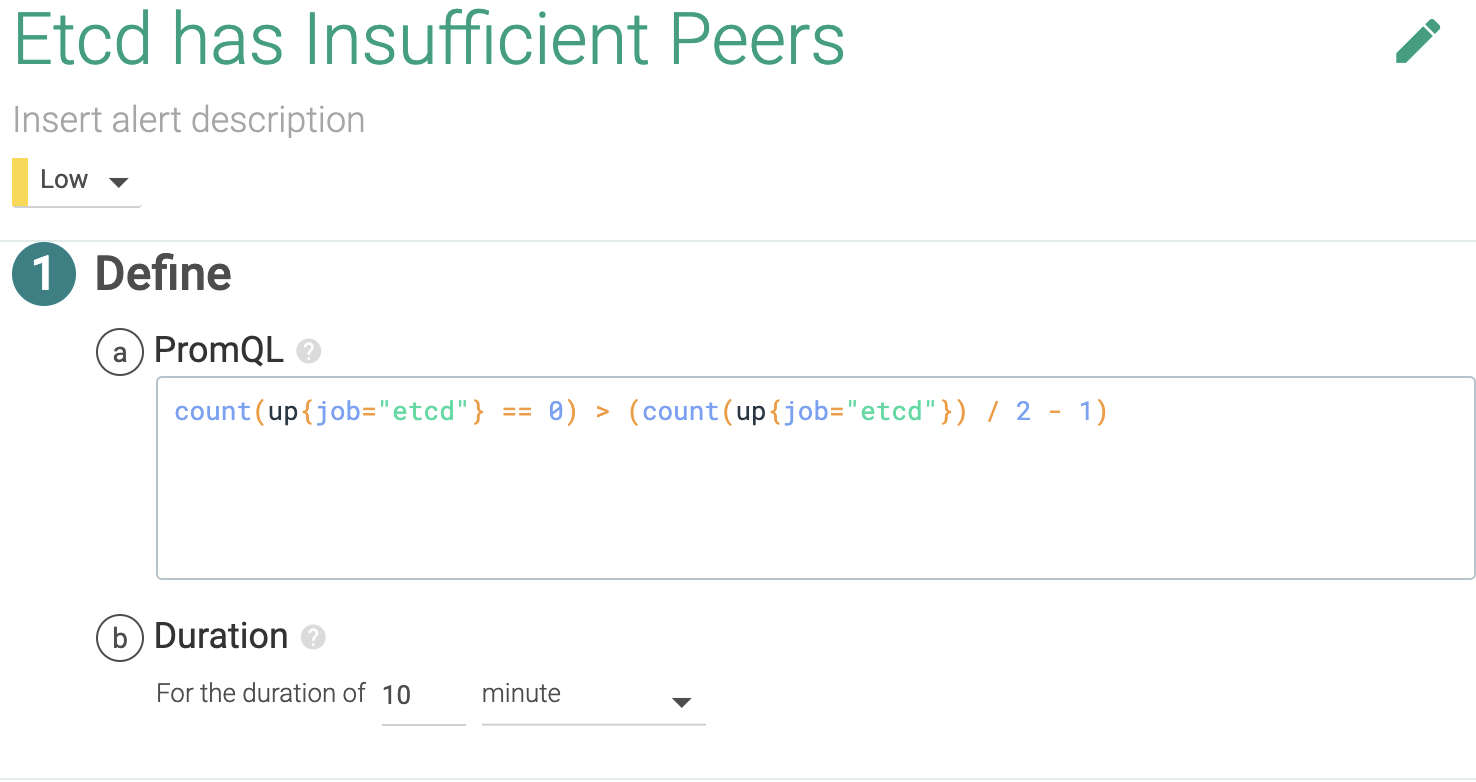
PromQL query:
count(up{job="etcd"} == 0) > (count(up{job="etcd"} == 0) / 2 - 1)
2.2 Is the Kubernetes API server running?
The Kubernetes API server is the center of the Kubernetes control plane. Again, monitoring this service is a job in itself, one that we covered in depth on How to monitor Kubernetes API server. For now, let’s configure an alert if the service goes down.
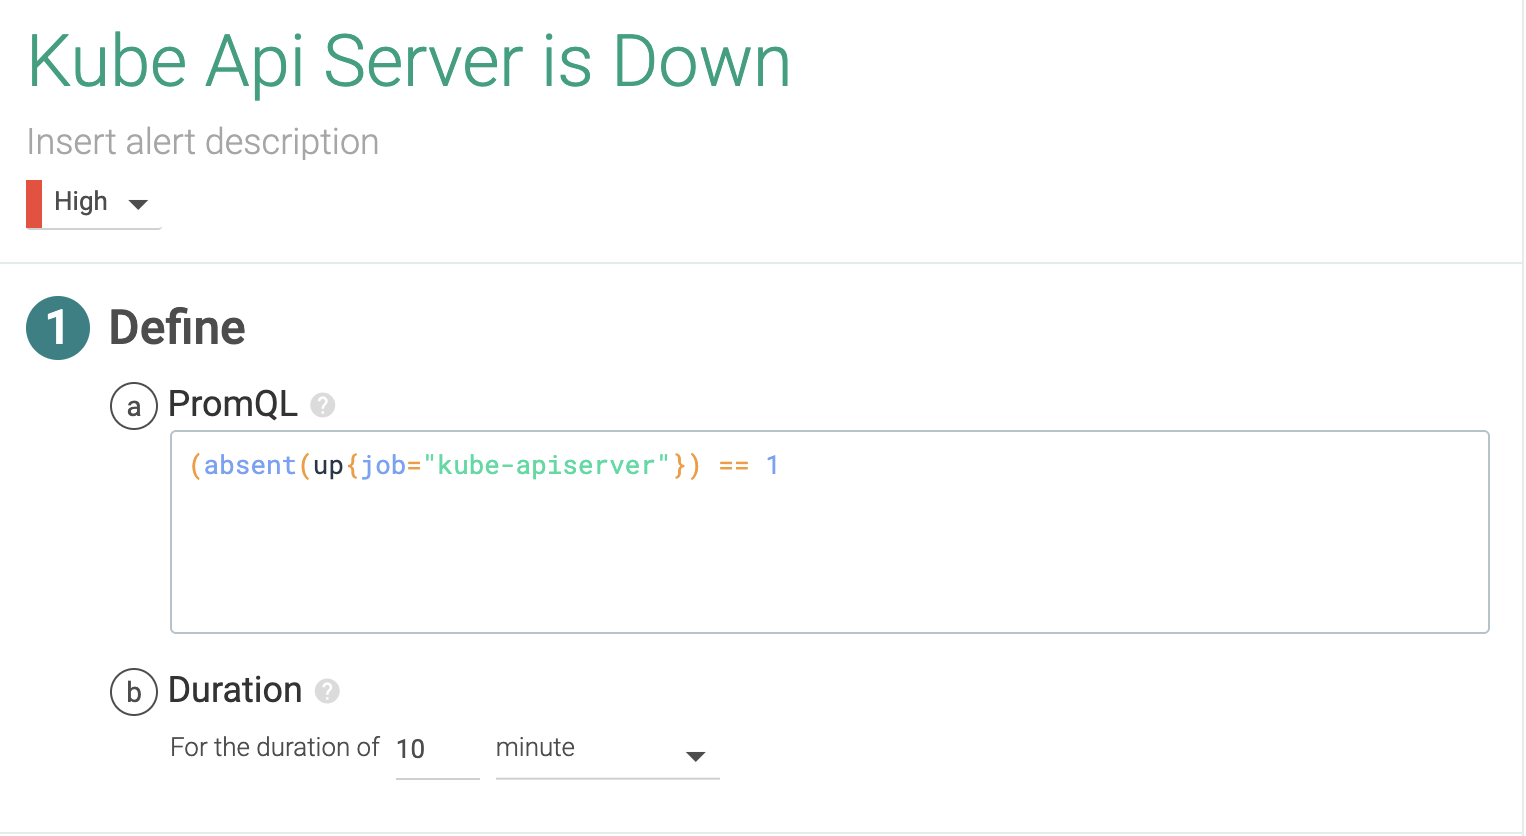
PromQL query:
(absent(up{job="kube-apiserver"})) == 1
2.3 Is the latency of kubelet too high for the start of the pods?
Kubelet is a very important service inside Kubernetes’ control plane. It’s the component that runs the containers described by pods in the nodes, so we can golden signal this and check the pod start rate and duration. High latency here could indicate performance degradation on the container runtime, or additional issues in trying to access the container images. You can learn more about kubelet on How to monitor Kubelet.
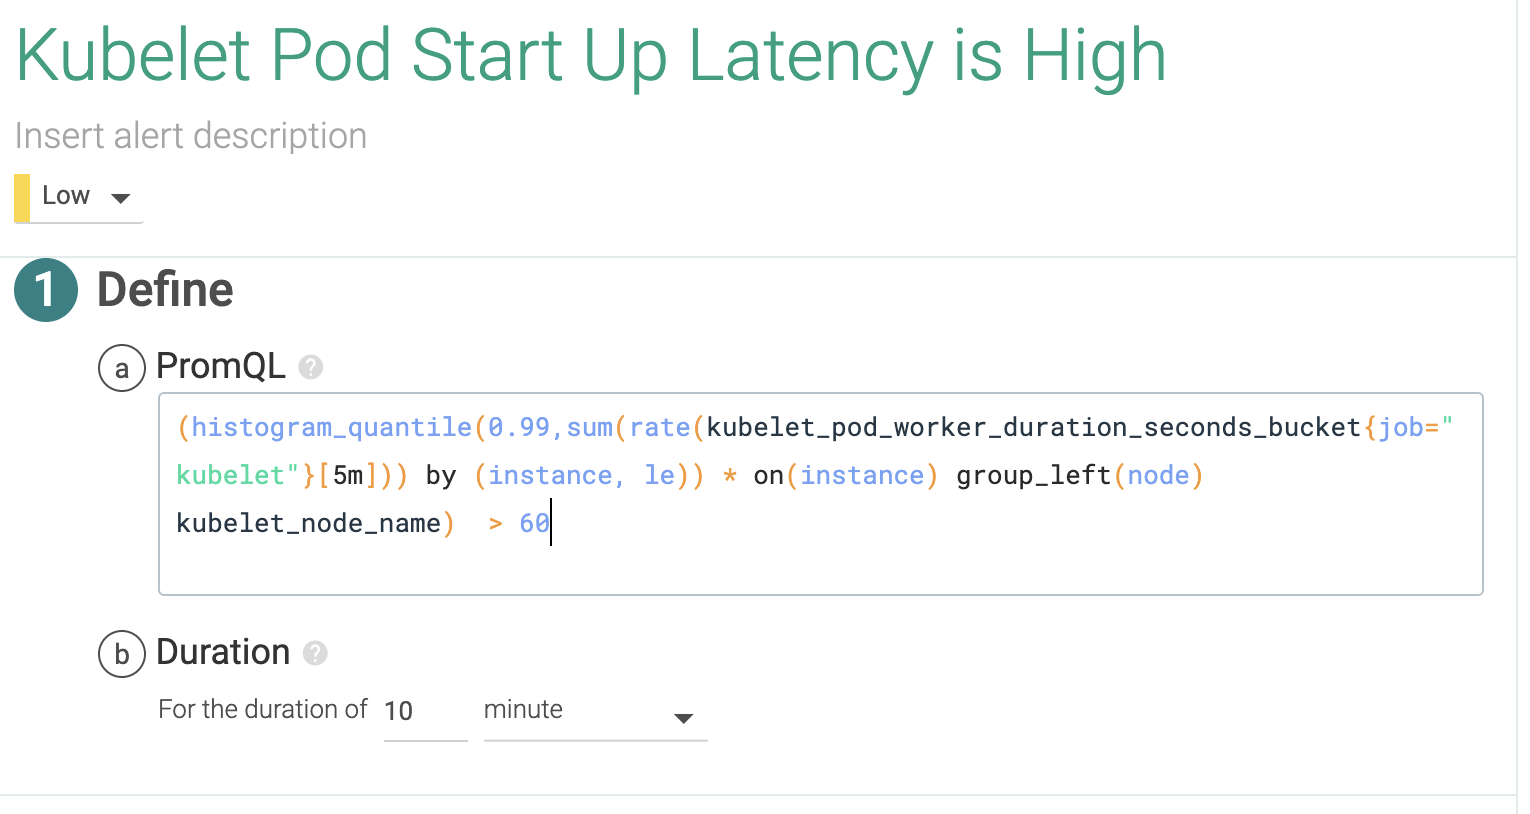
PromQL query:
(histogram_quantile(0.99,sum(rate(kubelet_pod_worker_duration_seconds_bucket{job="kubelet"}[5m])) by (instance,le)) * on(instance) group_left(node) kubelet_node_name ) > 60
2.4 Do we have enough Kubernetes nodes in our cluster?
A node failure isn’t a problem in Kubernetes since the scheduler will spawn the containers from the pods in the failed node into other available nodes. But what if we are running out of nodes? What if the resource requirements for the deployed applications overbook existing nodes? Are we hitting any quota limit?
Alerting in these cases isn’t easy, as it will depend on how many nodes you want to have on standby or how far you want to push oversubscription on your existing nodes. To monitor node status, alert on the metrics kube_node_status_ready and kube_node_spec_unschedulable.
An example of this would be this expression; this means the alert would trigger in case the sum of all of the requested resources is greater than the capacity of the cluster in case one of the nodes fails:
sum(namespace:kube_pod_container_resource_requests_cpu_cores:sum)
           /
         sum(node:node_num_cpu:sum)
           >
         (count(node:node_num_cpu:sum)-1) / count(node:node_num_cpu:sum)
If you want to alert on capacity, you will have to sum each scheduled pod requests for cpu and memory and then check that it doesn’t go over each node kube_node_status_capacity_cpu_cores and kube_node_status_capacity_memory_bytes.
For example, this query would alert in case the requested resources are above 90% of the available quota:
100 * kube_resourcequota{job="kubernetes-service-endpoints", type="used"}
           / ignoring(instance, job, type)
         (kube_resourcequota{job="kubernetes-service-endpoints", type="hard"} > 0)
           > 90
Alerting on services running on Kubernetes
When looking at the service level, it shouldn’t be too different from what you were doing before Kubernetes if you had already clustered your services. Think of databases like MySQL/MariaDB or MongoDB, where you will look at the replication status and lag. Is there anything to take into account now then?
Yes! If you want to know how your service operates and performs globally, you will need to leverage your monitoring tool capabilities to do metric aggregation and segmentation based on container metadata.
We know Kubernetes tags containers within a deployment, or exposed through a service, as we explained in How to monitor Kubernetes. Now, you need to take that into account when you define your alerts. For example, scoping alerts only for the production environment, probably defined by a namespace.
3.1 Do we have enough pods/containers running for each application?
Kubernetes has a few options to handle an application that has multiple pods: Deployments, ReplicaSets and ReplicationControllers. There are few differences between them but the three can be used to maintain a number of instances of running the same application. There, the number of running instances can be changed dynamically if we scale up and down, and this process can even be automated with auto-scaling.
There are also multiple reasons why the number of running containers can change. That includes rescheduling containers in a different host because a node failed or because there weren’t enough resources and the pod was evicted (don’t miss here our Understanding pod evicted), a rolling deployment of a new version, and more.
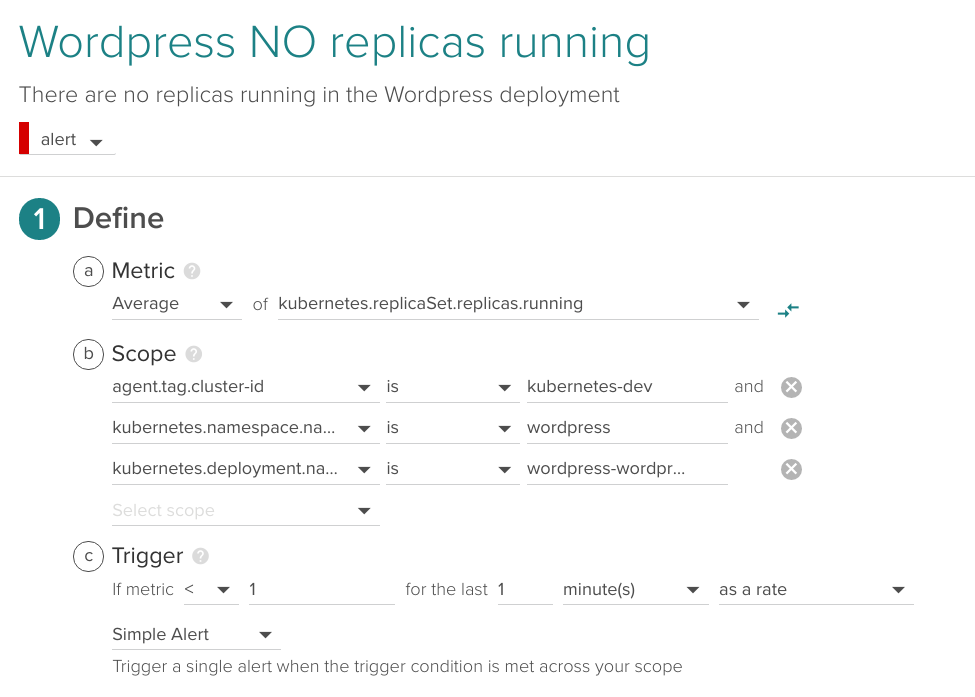
If the number of replicas or instances running during an extended period of time is lower than the number of replicas we desire, it’s a symptom of something not working properly (not enough nodes or resources available, Kubernetes or Docker Engine failure, Docker image broken, etc.).
An alert like this:
kube_deployment_spec_replicas{job="kubernetes-service-endpoints"}
           !=  kube_deployment_status_replicas_available{job="kubernetes-service-endpoints"}
That compares across all services, is almost a must in any Kubernetes alerting setup. As we mentioned before, this situation is acceptable during container reschedule and migrations, so keep an eye on the, configured .spec.minReadySeconds value for each container (time from container start until it becomes available in ready status). You might also want to check .spec.strategy.rollingUpdate.maxUnavailable which defines how many containers can be taken offline during a rolling deployment.
The following is an example alert with this condition applied to a deployment wordpress-wordpress within a wordpress namespace in a cluster with the name kubernetes-dev.
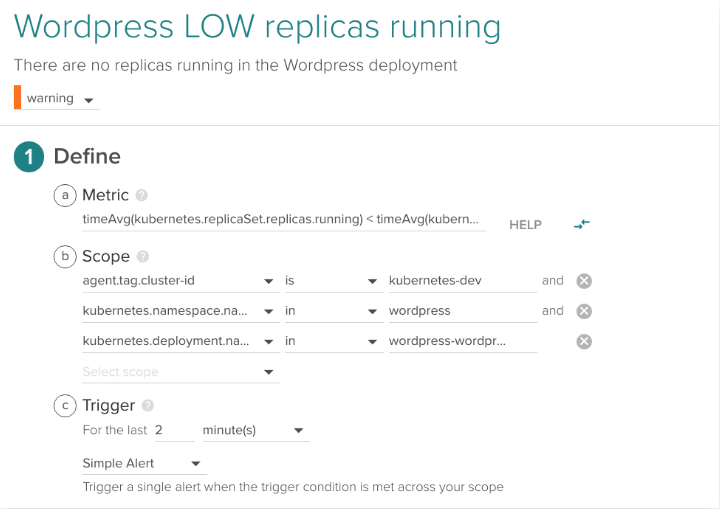
3.2 Do we have any pod/containers for a given application?
Similar to the previous alert but with higher priority (this one for example is a candidate for getting paged in the middle of the night), we will alert if there are no containers running at all for a given application.
In the following example, we apply the alert for the same deployment but trigger if running pods is < 1 during one minute:
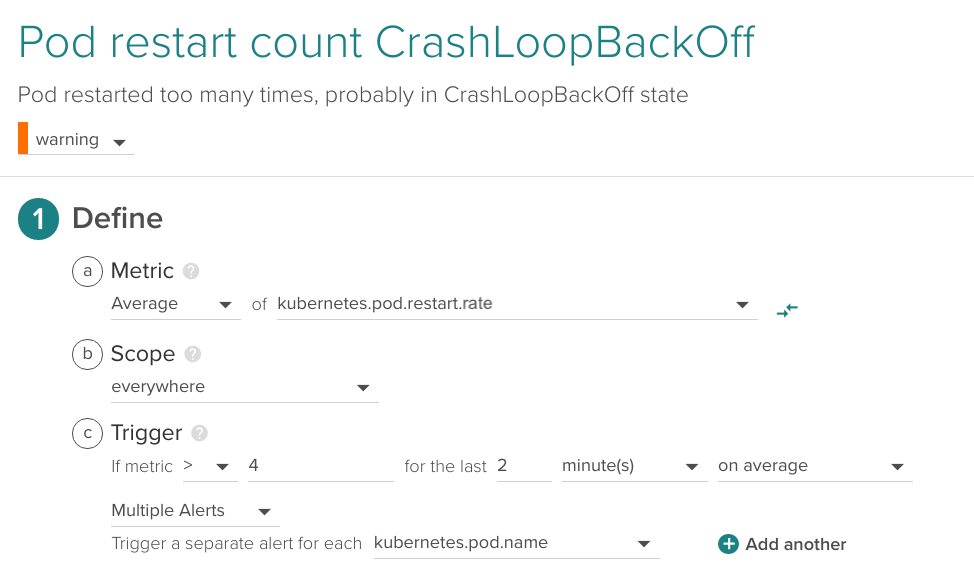
3.3 Is there any pod/container in a restart loop?
When deploying a new version which is broken, if there aren’t enough resources available or some requirements or dependencies are not in place, we might end up with a container or pod restarting continuously in a loop. This is called CrashLoopBackOff. When this happens, pods never get into ready status and therefore are counted as unavailable and not as running, so this scenario is already captured by the alerts before. Still, we like to set up an alert that catches this behavior across our entire infrastructure and lets us know the specific problem right away. It’s not the kind of alert that interrupts your sleep, but one that provides useful information.
This is an example applied across the entire infrastructure detecting more than four restarts over the last two minutes:
Alerting on application layer metrics
Metrics that allow you to confirm that your application performs as expected are known as working metrics, or Golden signals. In order to generate these metrics, you typically need to instrument your application via Prometheus metrics, statsd or JMX.
Some metrics and their alerts often found in this category are:
- Application availability up/down
- Application response time or latency
- Application error requests rate
- Application requests rate
- Middleware specific metrics: Python uwsgi workers, JVM heap size, etc.
- Database specific metrics: cache hits, indexes, etc.
The following example is a public REST API endpoint monitoring alert for latency over 10 seconds in a 10 minute window, over the java app deployment in the production namespace prod, using Prometheus custom metrics.
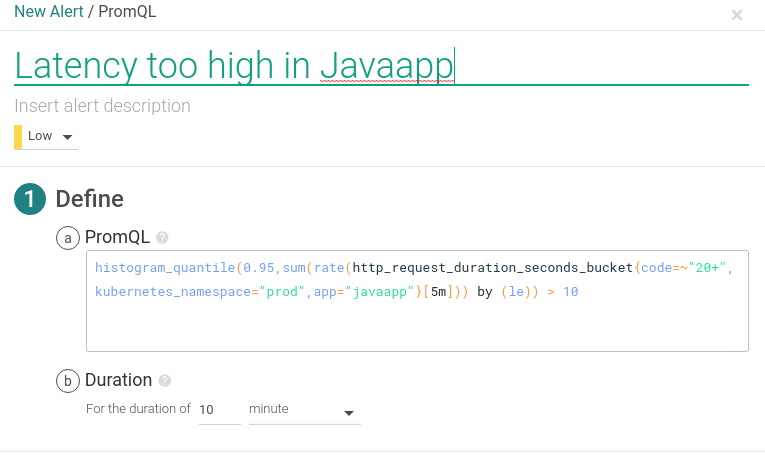
PromQL query:
histogram_quantile(0.95,sum(rate(http_request_duration_seconds_bucket{code=~"20+",kubernetes_namespace="prod",app="javaapp"}[5m])) by (le)) > 10
Conclusions
We’ve seen how using container orchestration platforms increase the number of pieces moving around in your system. Having container native monitoring and alerting for Kubernetes is a key element for having a reliable infrastructure.
Your Kubernetes alerting strategy cannot just focus on the infrastructure layer, but needs to understand the entire stack from the hosts and Kubernetes nodes at the bottom up to the top, where the application workloads and its metrics are. Being able to leverage Kubernetes and cloud providers metadata to aggregate and segment metrics and alerts will be a requirement for effective alerting across all layers.
Sysdig alerting capabilities combine an easy to use alert editor with all the power of PromQL to create advanced alerts with calculated metrics and mathematical functions at play. Sysdig Monitor allows DevOps teams to monitor and alert their Kubernetes environments leveraging Prometheus monitoring at scale.
But we’re not done yet. We have a number of follow up recommendations and encourage you to get Kubernetes Monitoring Fundamentals guide to learn more.
Haven’t tested Sysdig yet? Sign up for a free trial now!