
OpenStack Monitoring With Elasticsearch, Logstash, and Kibana

OpenStack is an open source project that allows enterprises to implement private clouds. Well-known companies such as PayPal and eBay have been using OpenStack to run production environments and mission-critical services for years.
However, establishing and running a private cloud is not an easy task — it involves being able to control a large and complex system assembled from multiple modules. Issues occur more frequently in such IT environments, so operations teams should log and monitor system activities at all times. This will help them solve performance issues before they even occur.
The Elasticsearch, Logstash and Kibana (ELK) open source stack is one of the leading logging platforms due to its scalability, performance, and ease of use. It’s well-suited for this purpose. Here, I will discuss OpenStack monitoring and provide a step-by-step guide that shows how to retrieve, ship, and analyze the data using the ELK Stack.
Retrieving the Logs
Most OpenStack services such as Nova, Cinder, and Swift write their logs to subdirectories of the /var/log directory. (For example, Nova’s raw log file is in /var/log/nova.) In addition, OpenStack allows you to retrieve the logs using its REST API and CLI. Here, we will use the API because it returns the data in a structured JSON format, making the logging and shipping process simpler due to its good compatibility with Logstash and Elasticsearch.
Authentication
To use the OpenStack APIs, you need an authentication token, which you can get from Keystone using the curl command:
curl -X POST -H "Content-Type: application/json" -d '{
   "auth": {
      "tenantName": "",
      "passwordCredentials": {
         "username": "",
         "password": ""
      }
   }
}' "http://:35357/v2.0/tokens/"
Where the TENANT_NAME is replaced with the name of the project for which we want to monitor, USERNAME and PASSWORD are your OpenStack environment admin credentials and OPENSTACK_IP is the IP address of your OpenStack.
The output:
{
 "access": {
  "token": {
   "issued_at": "2016-10-30T21:12:50.000000Z",
   "expires": "2016-10-30T22:12:50Z",
   "id": "39e077949d85401282651c96d257a2a2",
   "tenant": {
    "description": "",
    "enabled": true,
    "id": "e11130035c0d484cbf7fa28862dfa867",
    "name": ""
   },
   "audit_ids": [
    "N0i9WUUDRluNlaEBzCMGqg"
   ]
  },......
The id under the access.token property is the token that we use to access the APIs. In addition, make sure to keep the tenant id because we will use it later to monitor the specific tenant resources.
Nova Metrics
Similar to every other cloud, the core of OpenStack cloud is in Nova — the compute module. Nova is responsible for provisioning and managing the virtual machines. Nova monitoring can be segmented into three different layers — from the underlying hypervisor, through the single server/VM, and finally per specific tenant.
Hypervisor metrics expose the underlying infrastructure performance. The server metrics provide information on the virtual machines’ performance. Tenant metrics provide detailed information about user usage.
Hypervisor Metrics
Monitoring the hypervisor is very important. Issues with this layer will lead to broad failure and issues with VM provisioning and performance. The hypervisor exposes a lot of metrics, but you will need to pick the ones that are most important to you. We picked the following ones that we believe provide the baseline transparency that is required to keep a healthy environment:
- current_workload: number of tasks, for example, build, snapshot and migrate
- Running_vms: number of VMs.
- vcpus: number of use/available CPUs
- free_disk_gb: free hard drive capacity in GB
- free_ram_mb: Amount of available memory
These include available capacities for both computation and storage so that you can understand the load and lack of resources that can eventually harm your OpenStack cloud performance.
To retrieve this information, use the following:
GET http://:8774/v2.1/os-hypervisors/statistics
The output:
{
 "hypervisor_statistics": {
  "count": 1,
  "vcpus_used": 2,
  "local_gb_used": 2,
  "memory_mb": 3952,
  "current_workload": 0,
  "vcpus": 4,
  "running_vms": 2,
  "free_disk_gb": 43,
  "disk_available_least": 36,
  "local_gb": 45,
  "free_ram_mb": 2416,
  "memory_mb_used": 1536
 }
}
Server Metrics
Nova server metrics contain information about individual instances that operate on the computation nodes. Monitoring the instances helps to ensure that loads are being distributed evenly and that network activities and CPU times are being reported.
To retrieve the metrics information use the following:
GET http://:8774/v2.1//servers//diagnostics
The output:
{
 "tap884a7653-01_tx": 4956,
 "vda_write": 9477120,
 "tap884a7653-01_rx_packets": 64,
 "tap884a7653-01_tx_errors": 0,
 "tap884a7653-01_tx_drop": 0,
 "tap884a7653-01_tx_packets": 88,
 "tap884a7653-01_rx_drop": 0,
 "vda_read_req": 177,
 "vda_read": 1609728,
 "vda_write_req": 466,
 "memory-actual": 524288,
 "tap884a7653-01_rx_errors": 0,
 "memory": 524288,
 "memory-rss": 271860,
 "tap884a7653-01_rx": 8062,
 "cpu0_time": 21850000000,
 "vda_errors": -1
}
The list of the servers per project:
GET http://:8774/v2.1//servers
The output is the list of servers in the project:
{
 "servers": [
  {
   "id": "6ba298fb-9a8f-42da-ba67-c7fa6fea0528",
   "links": [
    {
     "Href": "http://localhost:8774/v2.1/8e5274818a1b49268c55e5c94b3aa654/servers/6ba298fb-9a8f-42da-ba67-c7fa6fea0528",
     "rel": "self"
    },
    {
    "href": "http://localhost:8774/8e5274818a1b49268c55e5c94b3aa654/servers/6ba298fb-9a8f-42da-ba67-c7fa6fea0528",
    "rel": "bookmark"
   }
  ],
  "name": "test-instance-2"
 },
 {
  "id": "b7f7d288-f2d2-4c5e-b1b7-d50d16508560",
  "links": [
   {
    "href": "http://localhost:8774/v2.1/8e5274818a1b49268c55e5c94b3aa654/servers/b7f7d288-f2d2-4c5e-b1b7-d50d16508560",
    "rel": "self"
   },
   {
    "href": "http://localhost:8774/8e5274818a1b49268c55e5c94b3aa654/servers/b7f7d288-f2d2-4c5e-b1b7-d50d16508560",
    "rel": "bookmark"
   }
  ],
  "name": "test-instance-1"
 }
 ]
}
Tenant Metrics
The tenant (or project) is the group of users that has access to specific resources and where resources quotas are defined. Monitoring the quota with the instances inside of each project can be very useful in identifying the need for change with particular quotas in line with resource allocation trends.
Get the quota per tenant looks, for example:
GET http://:8774/v2.1/os-quota-sets/

{
 "quota_set": {
  "injected_file_content_bytes": 10240,
  "metadata_items": 128,
  "server_group_members": 10,
  "server_groups": 10,
  "ram": 51200,
  "floating_ips": 10,
  "key_pairs": 100,
  "id": "8e5274818a1b49268c55e5c94b3aa654",
  "instances": 10,
  "security_group_rules": 20,
  "injected_files": 5,
  "cores": 20,
  "fixed_ips": -1,
  "injected_file_path_bytes": 255,
  "security_groups": 10
 }
}
The Fourth Component: RabbitMQ
In addition to these three groups, Nova components use RabbitMQ for both remote procedure calls (RPCs) and internal communication. It is crucial to log and monitor its performance because it is the default OpenStack messaging system. If this fails, it will disrupt your whole cloud deployment.
The following metrics will be collected using rabbitmqctl:
count: number of active queues
Command: rabbitmqctl list_queues name | wc -l
memory: size of queues in bytes
Command: rabbitmqctl list_queues name memory | grep compute
Output:
cinder-scheduler      14200
cinder-scheduler.dc-VirtualBox      13984
cinder-scheduler_fanout_67f25e5fa06646dc86ae392673946734  22096
cinder-volume 13984
cinder-volume.dc-VirtualBox@lvmdriver-1    14344
cinder-volume_fanout_508fab760c8b4449b77ec714efd0810a     13984
compute 13984
compute.dc-VirtualBox 14632
compute_fanout_faf59434422844628c489ed035f68407   13984
consumers: number of consumers by the queue
Command: rabbitmqctl list_queues name consumers | grep compute
Log Shipping
The next step is to aggregate all of the logs and ship them to Elasticsearch. Here, we will present two methods: one using Logstash and the second using an Amazon S3 bucket.
Using Logstash
One of the most fundamental tools for moving logs is Logstash, which is one of the three components of the ELK Stack that I mentioned earlier. When using Logstash, the input, output, and filter should be specified. Together, they define the transportation and transformation of the logs.
(New to Logstash? Learn how to get started with Logstash!)
The Logstash configuration file can look like the following:
// The input block below defines the source of log data and shows how a particular log source will be processed. This includes parameters such as the frequency (interval) of new incoming data.
input {
   exec {
      command => "curl -X GET -H 'X-Auth-Token: 4357b37bbfed49e089099b8aca5b1bd7' http://<IP>:8774/v2.1/os-hypervisors/statistics"
      interval => 2
      type => "hypervisor-stats"
   }

   exec {
      command => "curl -X GET -H 'X-Auth-Token: 4357b37bbfed49e089099b8aca5b1bd7' http://<IP>:8774/v2.1/<tenant-id>/servers/<server-id>/diagnostics"
      interval => 2
      type => "instance-1"
   }

   exec {
      command => "curl -X GET -H 'X-Auth-Token: 4357b37bbfed49e089099b8aca5b1bd7' http://localhost:8774/v2.1/<tenant-id>/servers/<server-id>/diagnostics"
      interval => 2
      type => "instance-2"
   }

   exec {
      command => "curl -X GET -H 'X-Auth-Token: 4357b37bbfed49e089099b8aca5b1bd7' http://localhost:8774/v2.1/os-quota-sets/<tenant-id>"
      interval => 2
      type => "tenant-quota"
   }

   exec {
      command => "sudo rabbitmqctl list_queues name | wc -l"
      interval => 2
      type => "rabbit-mq-count"
   }

   exec {
      command => "sudo rabbitmqctl list_queues name memory | grep compute"
      interval => 2
      type => "rabbit-mq-memory"
   }

   exec {
      command => "rabbitmqctl list_queues name consumers | grep compute"
      interval => 2
      type => "rabbit-mq-consumers"
   }

}
// The Filters below are used to process the logs in the Logstash pipeline and can drop, convert, or even replace part of a log.
filter {

       if [type] == "hypervisor-stats" {

       } else if [type] == "instance-1" {
              json {
                    source => "message"
              }
       } else if [type] == "instance-2" {
              json {
                    source => "message"
              }
       } else if [type] == "tenant-quota" {
              json {
                    source => "message"
              }
       } else if [type] == "rabbit-mq-count" {
              grok {
                    match => {"message" => "%{NUMBER:count}"}
              }
              mutate {
                     convert => { "count" => "integer" }
              }
       } else if [type] == "rabbit-mq-memory" {
              split {

              }
              csv {
                    columns => ["name", "amount"]
                    separator => " "
                    convert => { "amount" => "integer" }
              }
       } else if [type] == "rabbit-mq-consumers" {
              split {
              }
              csv {
                   columns => ["name", "count"]
                   separator => " "
                   convert => { "count" => "integer" }
              }

       }
       mutate {
       add_field => { "token" => "XmQHXXBnvNXanECxefFmNejREliRJmaW" }
       }

}
// The output block is there to define where the data will be sent.
output {

   elasticsearch {
      hosts => ["<IP_address_of_elasticsearch:9200"], codec => "json_lines"
   }
}
//// If you a Logz.io user you can use the following.
output {

   tcp {
   host => "listener.logz.io"
   port => 5050
   codec => json_lines
   }
}Note: This Logstash example is not ideal because we have to work with a fixed number of tenants and instances per project. However, if your environment is highly dynamic, you will need to develop a mechanism that auto-discovers and updates the tenant and instance information.
Using S3
There are several ways to store files in S3, but using Logz.io makes it easy to configure and seamlessly ship logs to the ELK Stack with S3. You will not have to automate the export and import of data.
In this example, we will reuse our previous Logstash configuration to store the logs in an S3 bucket that will be continuously tracked and used by the Logz.io ELK Stack. For that purpose, we will change the last part of the Logstash configuration (the output section) to point to the S3 bucket:
……
output {

   s3{
    access_key_id => ""
    secret_access_key => ""
    region => ""
    bucket => ""
    size_file => 2048
    time_file => 5
   }
}
After executing ./bin/logstash -f <PATH_TO_THE_LOGSTASH_CONFIG> the files will be there. Now, they’re ready to be shipped to Elasticsearch.
(Don’t have a Logz.io account? Start your free trial here!)
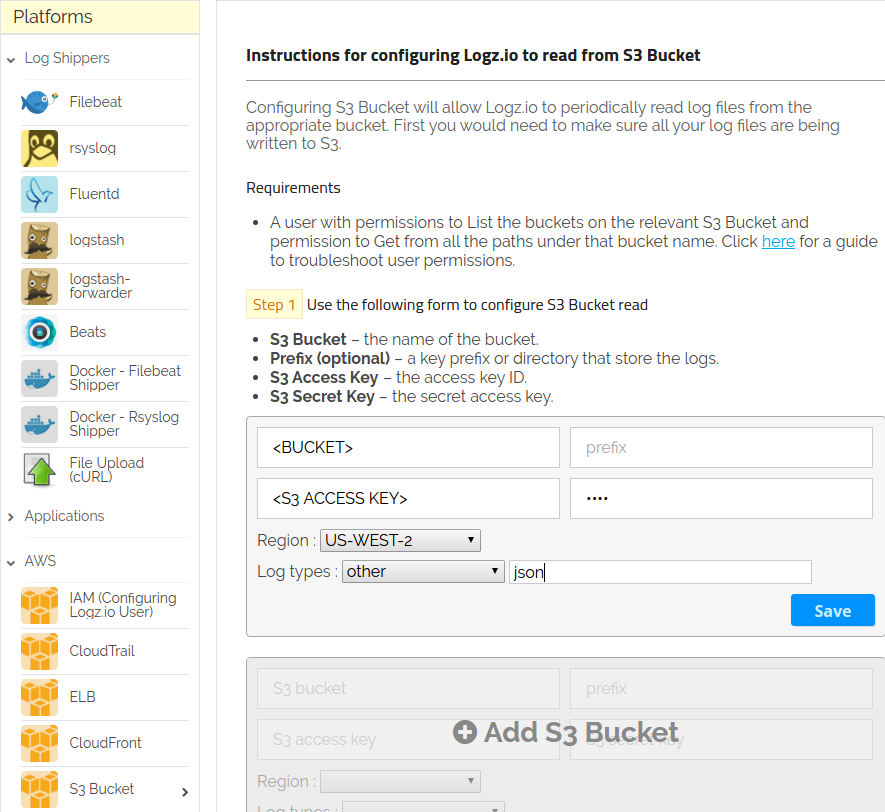
Next, log into your Logz.io account and select Log Shipping. Then, look for the S3 Bucket option in the left-hand menu and fill out the input fields with the required information that is shown below:
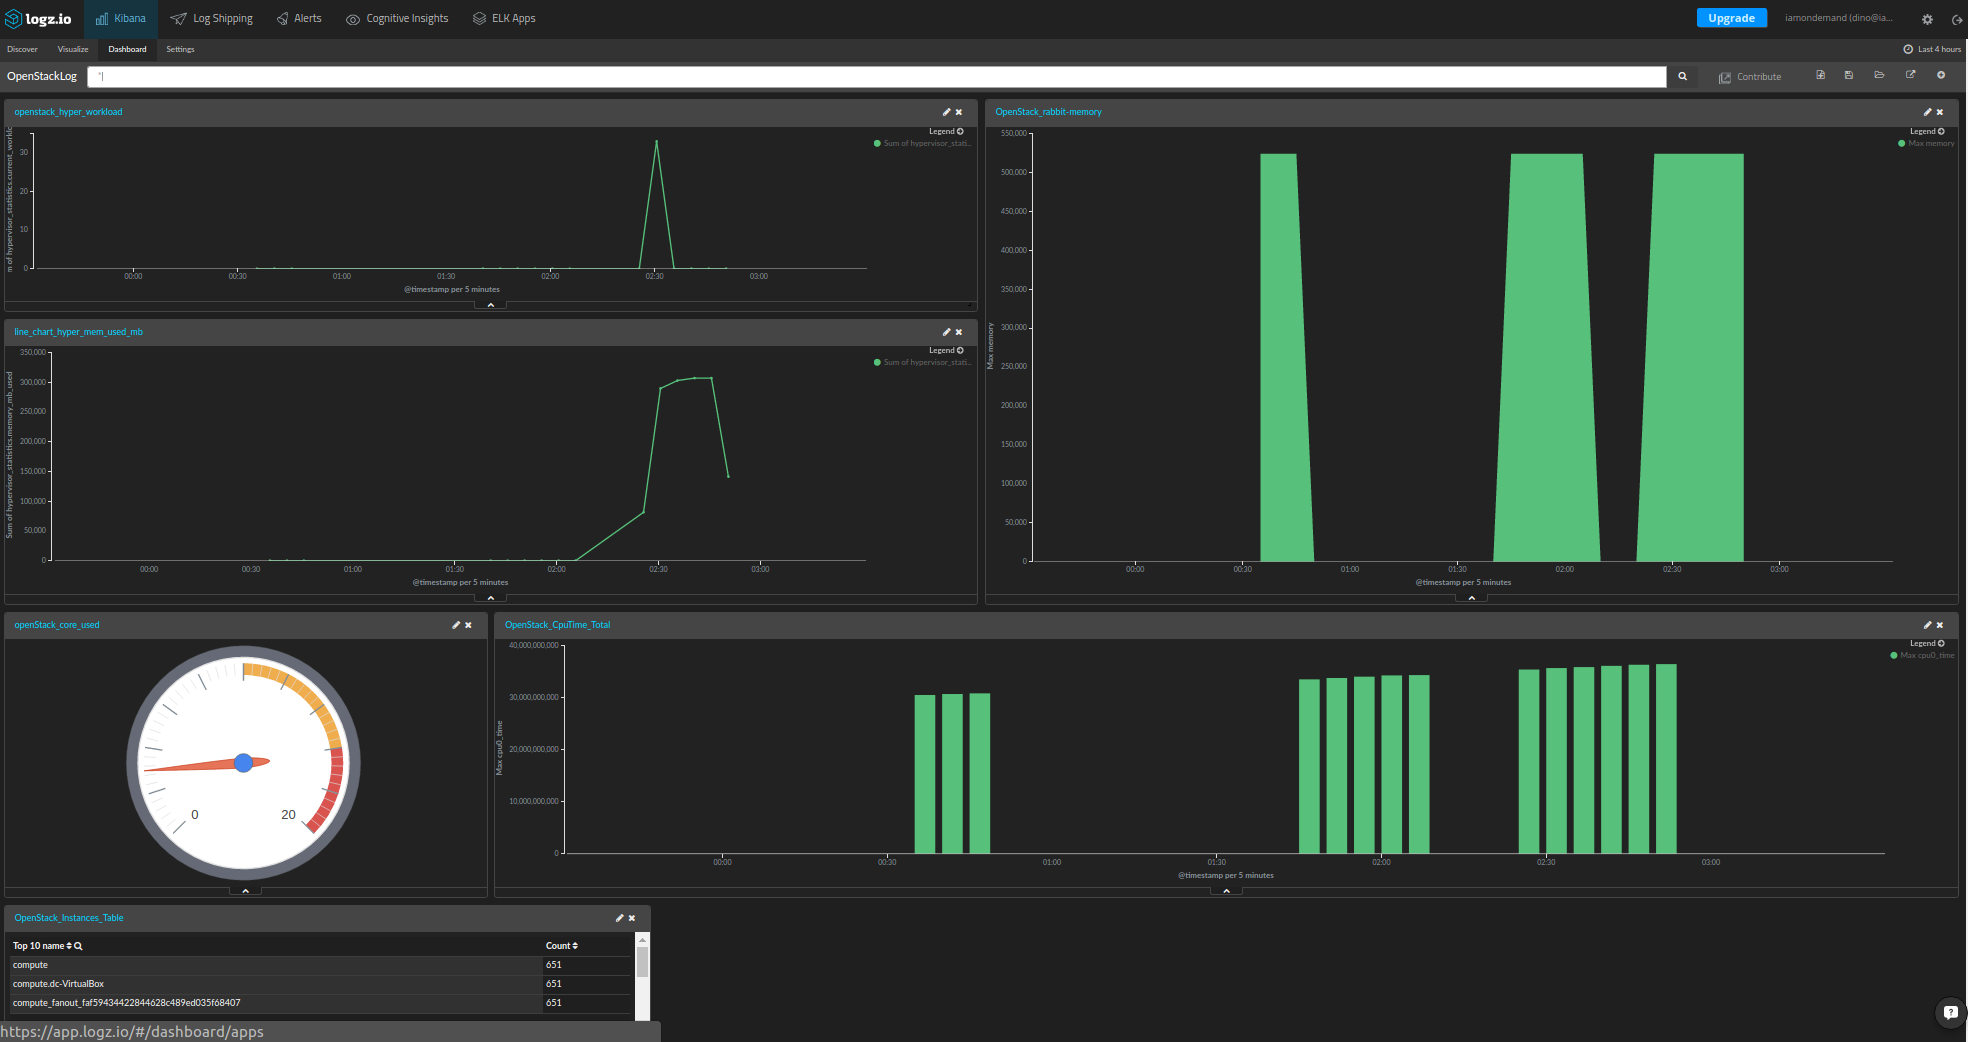
Build The Dashboard
Now, we are ready to present the shipped metrics data. First, we will start with the hypervisor metrics:
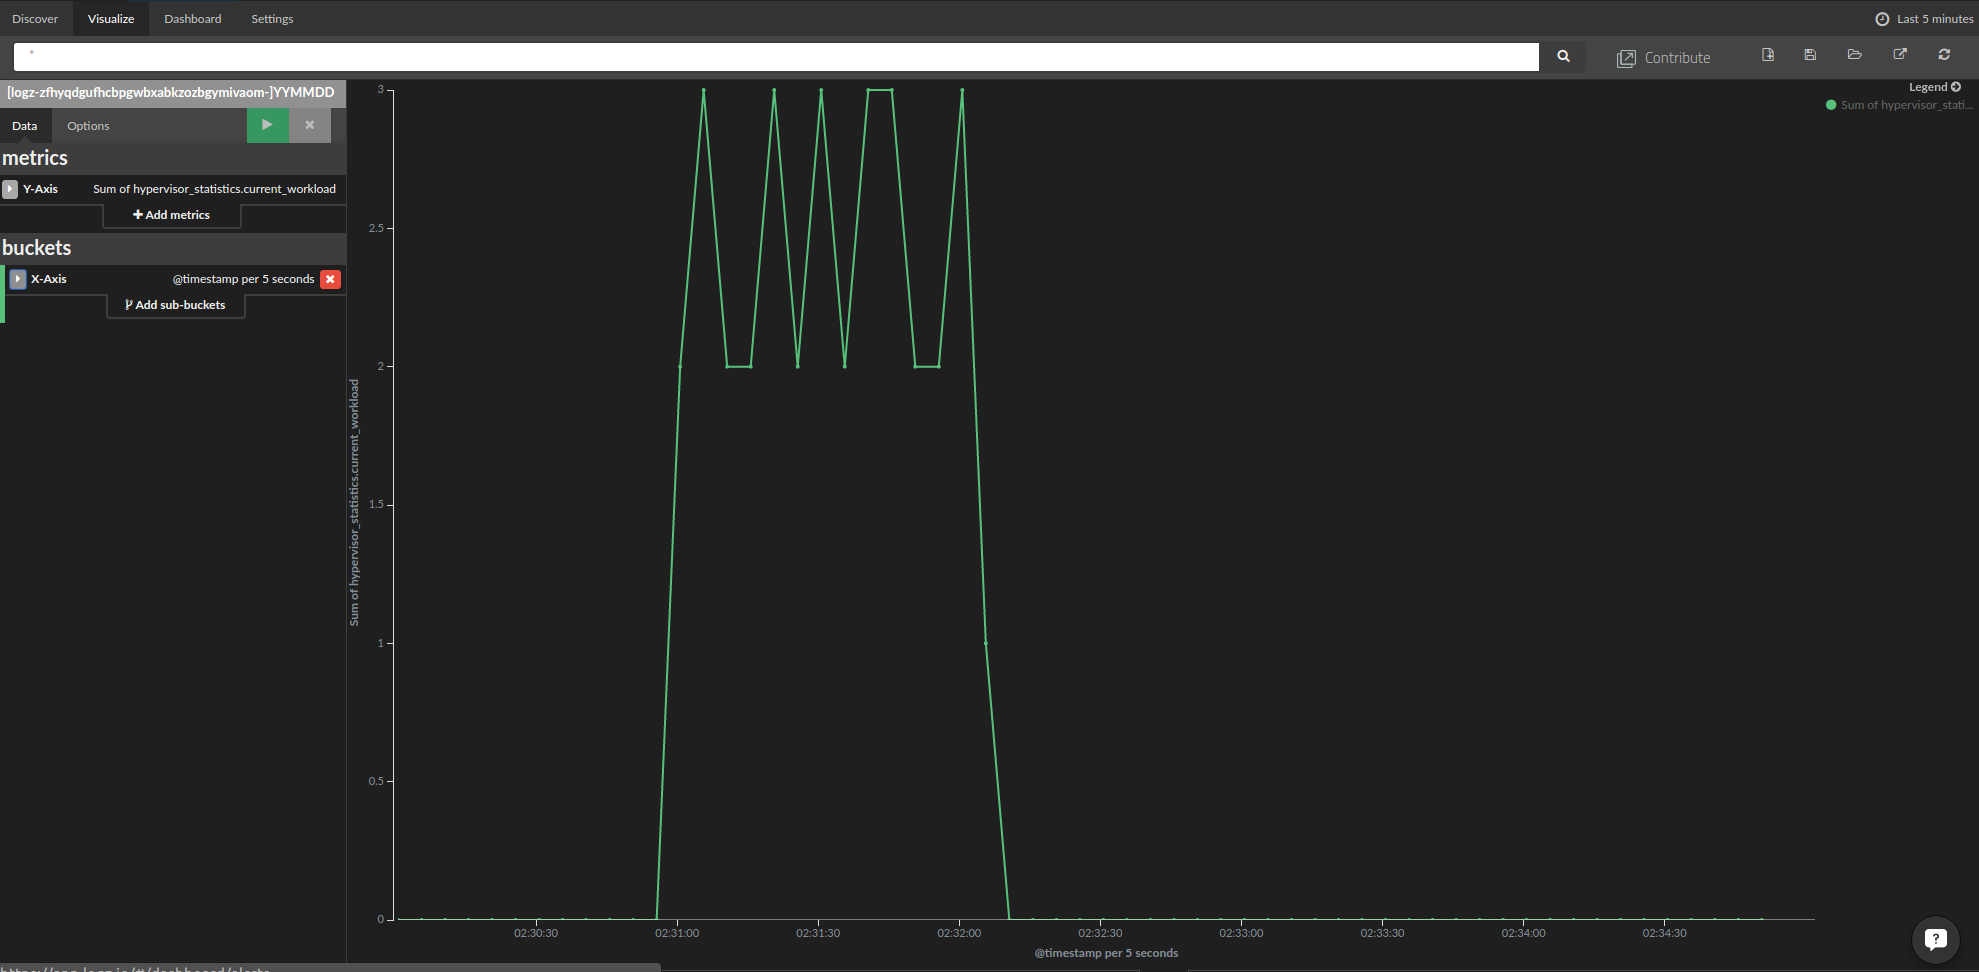
- To create the chart, click on the Visualize item in the menu at the top of the page and select the type of chart that you want to use. In our case, we used a line chart.
- In the Metrics settings, select the type of aggregation. We used the sum over the hypervisor current workload field.
- In the Buckets settings, we selected Date Histogram for the X axis in the drop-down menu and left “automatic” for the interval.
The resulting chart is shown below:
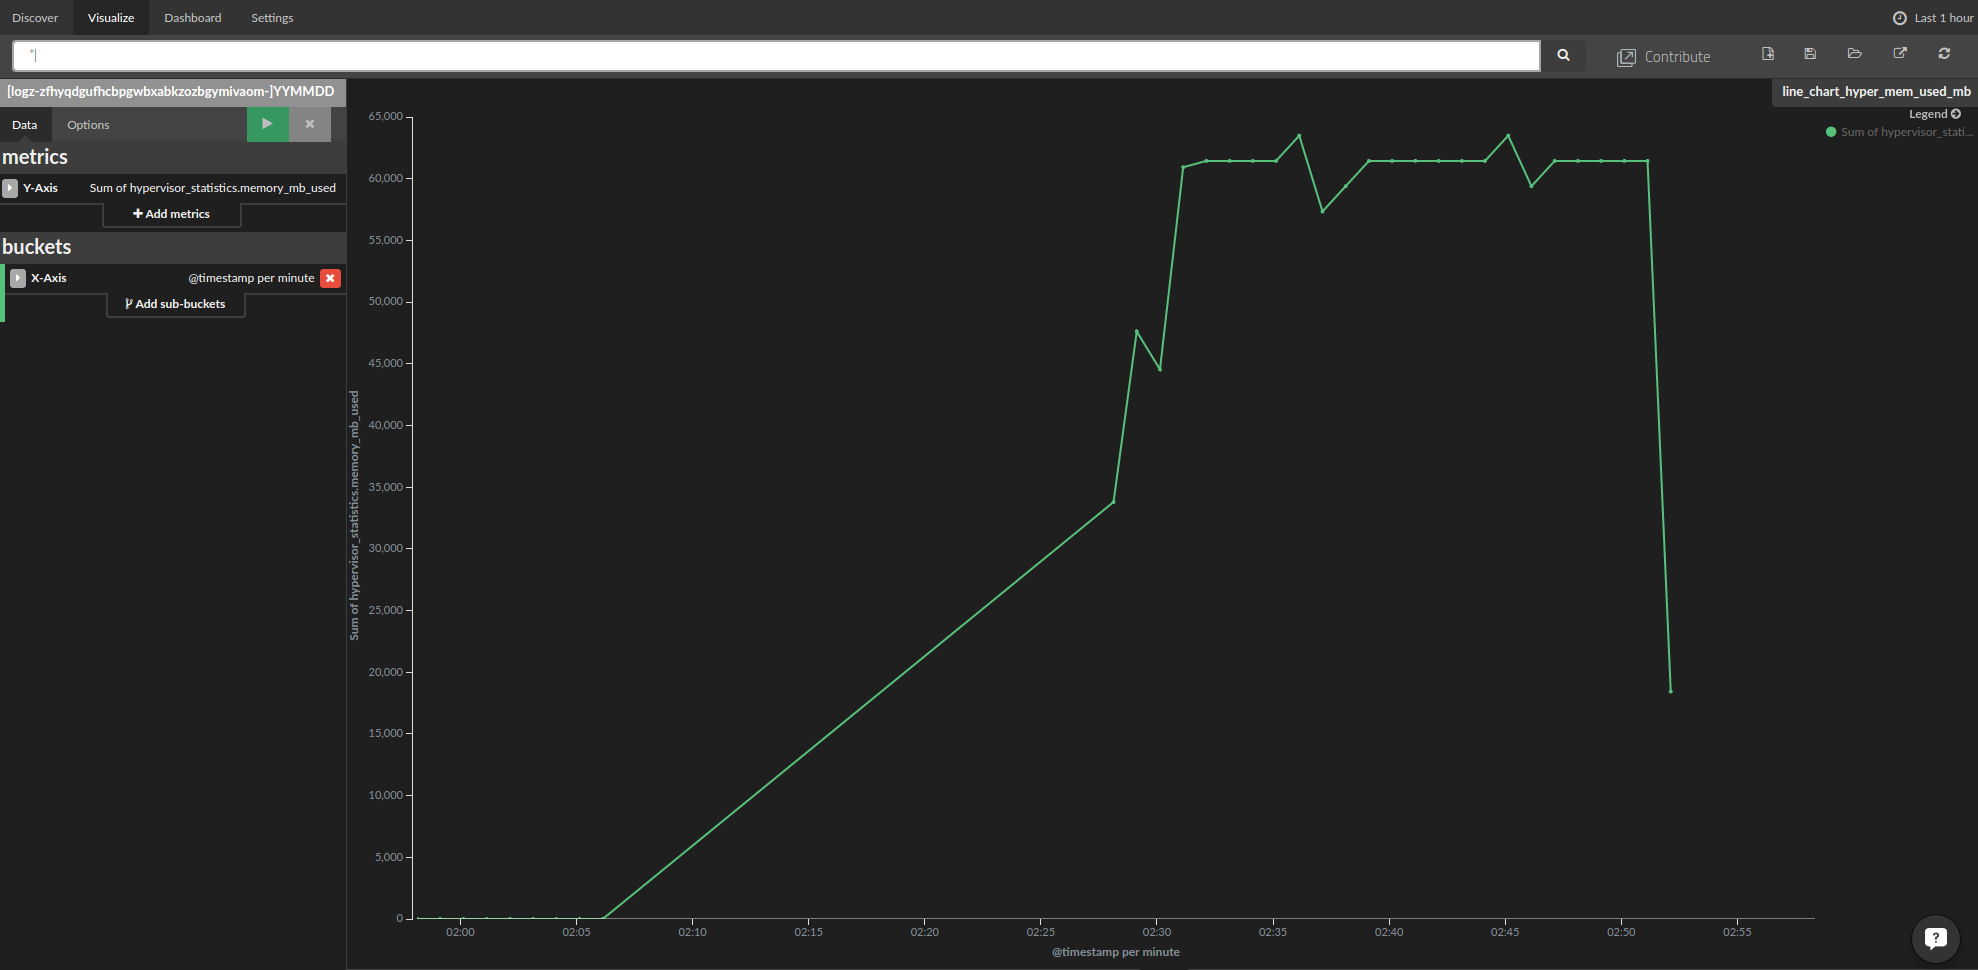
We followed almost the same steps to create the following charts for the hypervisor memory usage and the number of cores (hypervisor_statistics.vcpus_used) in use:
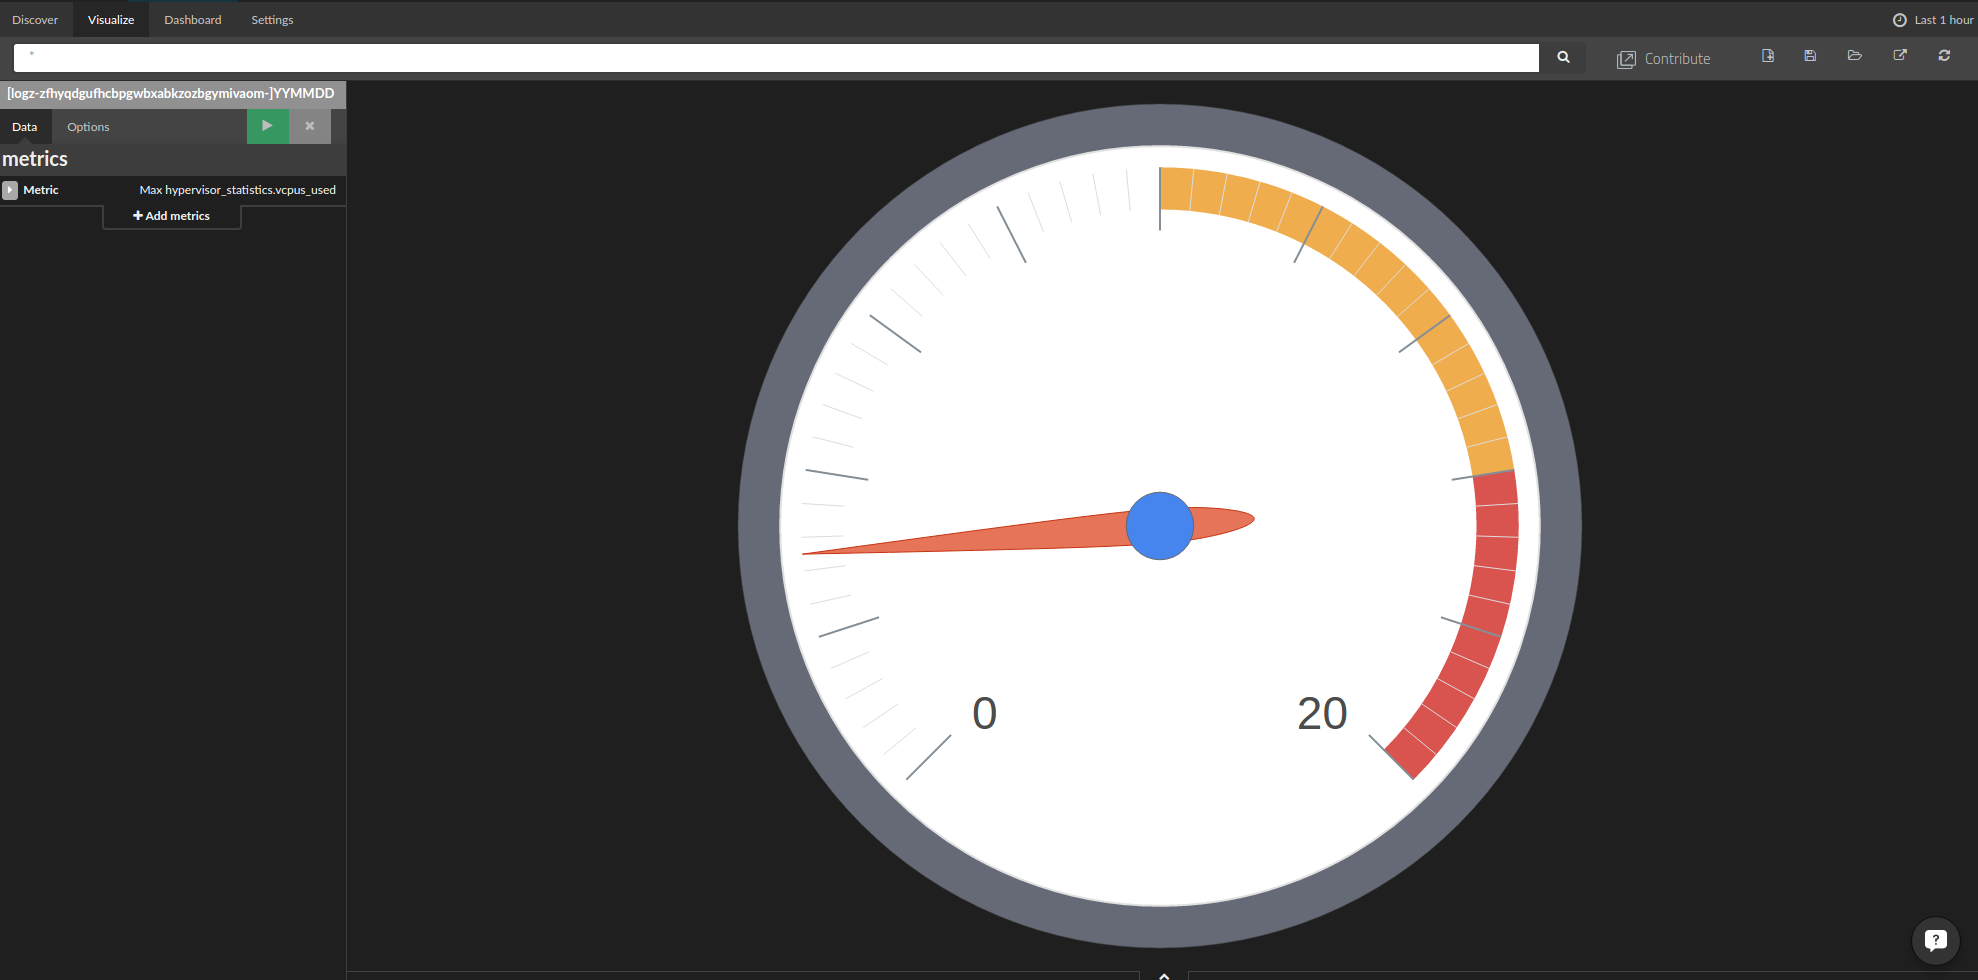
To create the above image, we defined the minimum and maximum values so that we can easily see if the tenants are about to hit their core limits.
Kibana’s flexibility on top of the OpenStack logs in Elasticsearch allow us to create a comprehensive and rich dashboard to help us to control and monitor our cloud.
The Conclusion
By its nature, the OpenStack cloud is a complex and evolving system that continuously generates vast amounts of log data. However, not all of this data can be accessed easily without a robust and structured monitoring system.
More on the subject:
The ELK Stack not only provides the robustness and supports the real-time performance required, but when correctly deployed, it is also flexible enough to support the ongoing monitoring and control that cloud operations teams must have.
Related Articles:
You Might Also Like

Logz.io Live Demo

Balancing Work from Home and Family with ADD
Get started for free
Completely free for 14 days, no strings attached.