The NIH-Wide Strategic Plan for Fiscal Years (FYs 2016-2020) laid the groundwork for discussing data on our funding strategies—see page 28 for example data on R01 applications across peer review percentiles in FY 2014. The 21st Century Cures Act recognized the value of reporting such information. Building on what we have blogged on before (see here, here, here, and here), let’s talk more about how we make funding decisions and show some data as well.
Funding decisions rely heavily on peer review scores, but there is more to the story. NIH Institutes and Centers (ICs) weigh those scores together with ensuring their entire research portfolio addresses the wide array of diseases, conditions, or other research areas within its mission. They also account for unmet scientific needs and build on recent unexpected breakthroughs as part of prudent planning. When public health needs emerge, such as for the opioid epidemic or a microbial outbreak, ICs must be nimble enough to respond. Training, work force, and infrastructure needs are also thrown into the mix. Want more? See our NIH Funding Strategies page and find individual IC strategic plans on NIH RePORT.
Some ICs, though not all, set percentile-based paylines each fiscal year. R01 applications that fall below the payline are likely to be funded, while those above may not. Moreover, not every application scored within the payline, it should be noted, may be selected for funding (see here for some reasons why). ICs can also use a small portion of their discretionary annual budget to support meritorious applications that did not meet the payline, a process called select pay.
Expanding on what was provided in the NIH Strategic Plan, we present FY 2018 data here on R01-equivalent applications (which include R37-MERIT), and R56-Bridge awards. These data (available here in the NIH Data Book) are restricted to those investigator-initiated R01 applications or awards reviewed by a study section and which received a percentile score.
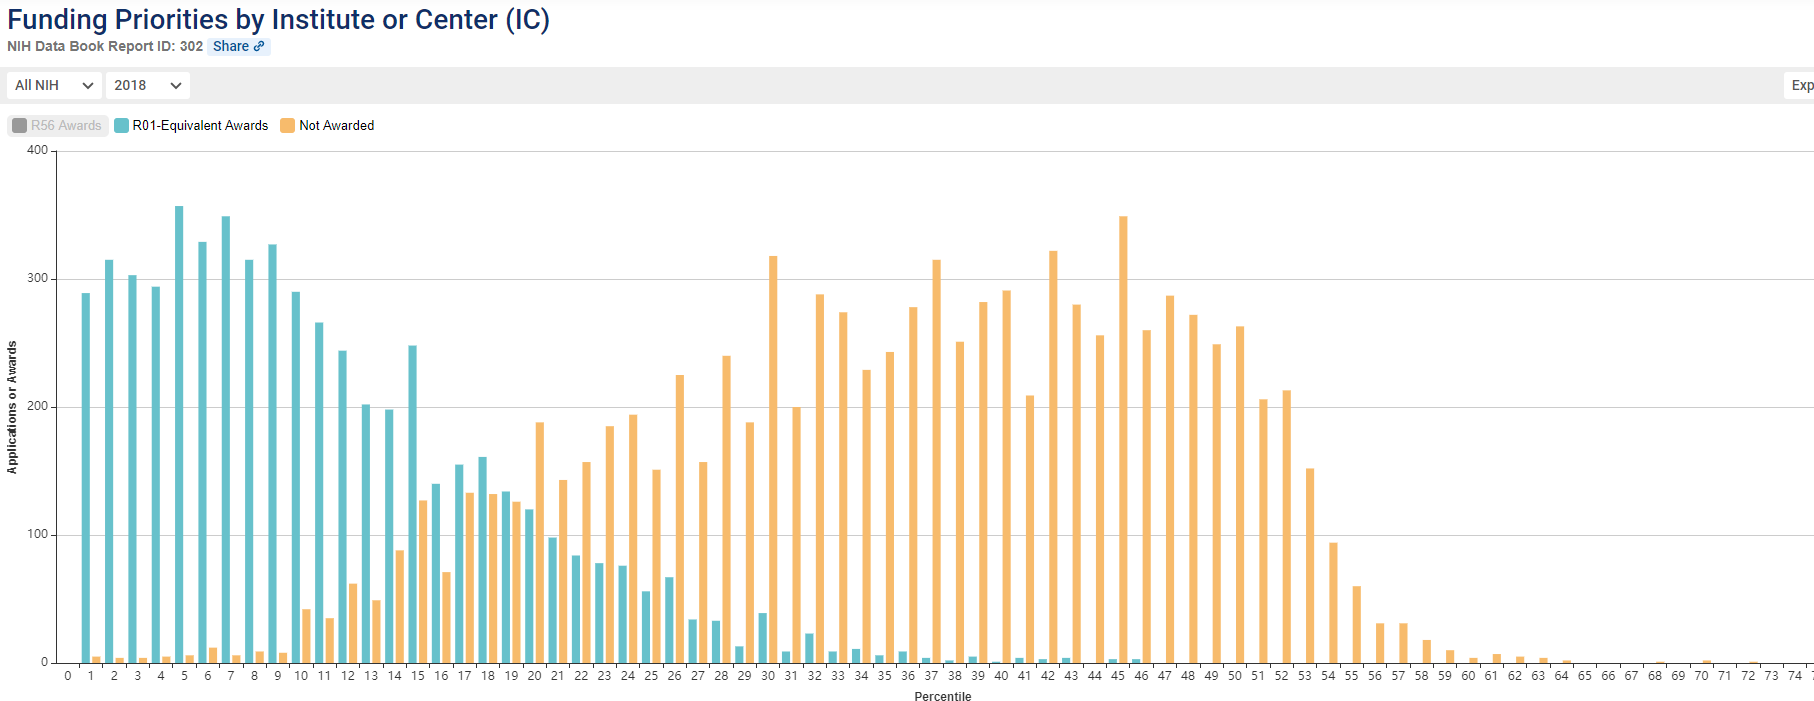
In FY 2018, NIH issued 5,710 R01-equivalent grant awards, while 9,309 applications were not funded. As shown in Figure 1, these R01-equivalent awards were generally within the 1st–36th percentiles of all applications (light blue bars). Unfunded applications fell in the higher percentiles (yellow bars).

For those at higher percentiles in Figure 1, an IC may have opted to fund these applications for reasons such as supporting early stage investigators, addressing a gap in scientific knowledge, responding to an emerging health threat, or fostering an innovative approach.
Moving on, R56 grants provide a year or two of funding directed to high-priority new or competing renewal R01 applications, from domestic applicants, with impact scores or percentiles that fall just outside the funding limits for participating ICs (NOT-OD-04-047). With consideration from peer reviewers and Councils, NIH will nominate creative, innovative, and meritorious R01 applications that fall just beyond the established payline for conversion to an R56. Investigators cannot directly apply for an R56.
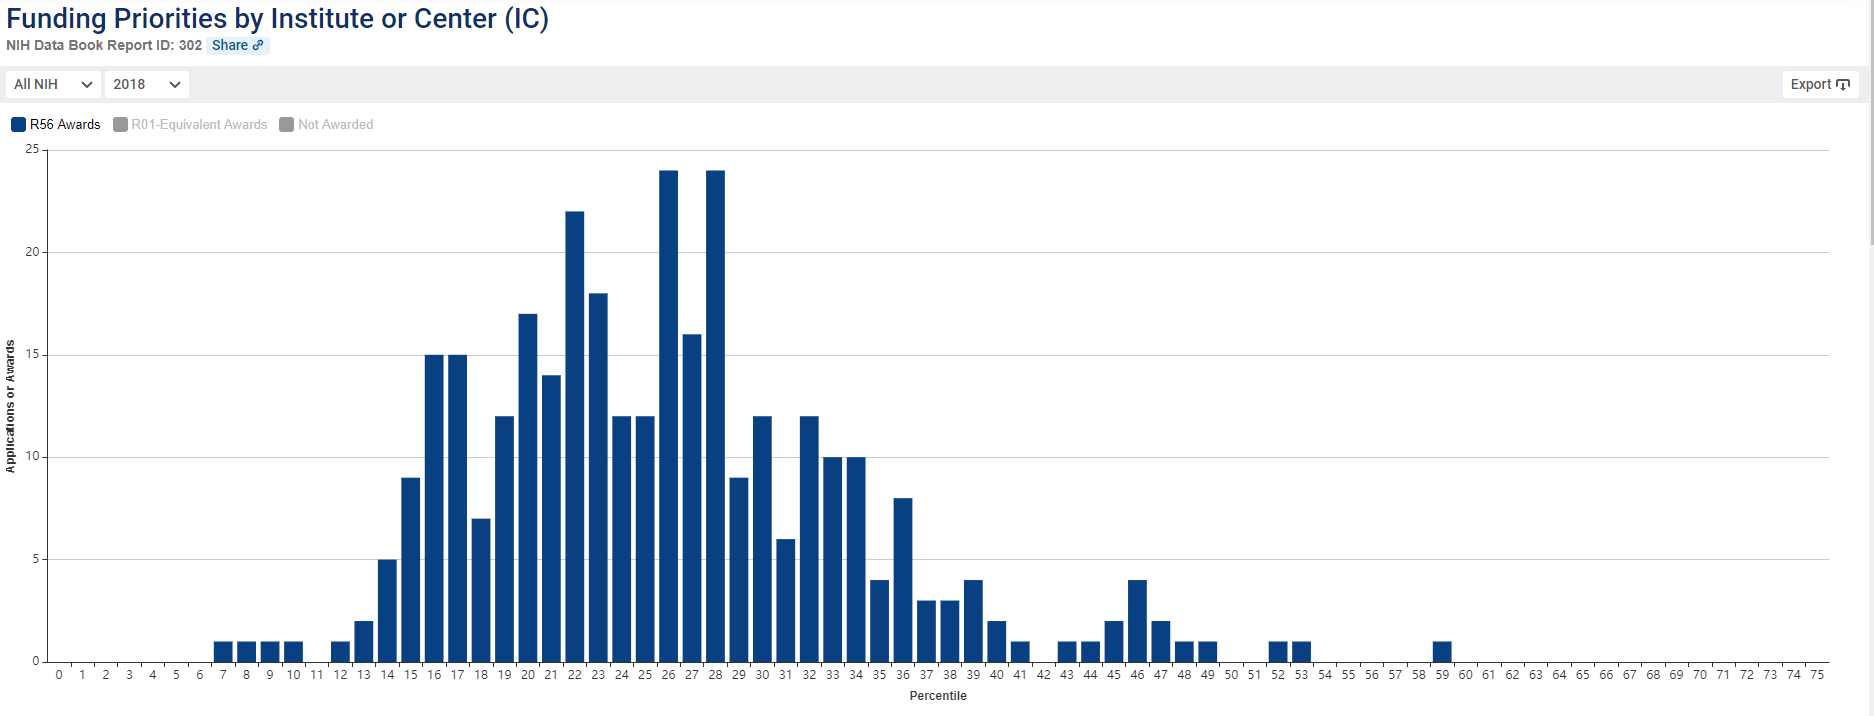
In Figure 2, data are presented for R56 awards based on the score and percentile for the corresponding nominated R01 application. We see that R56 awards made in FY 2018 clustered between the 16th–32nd percentiles (dark blue bars). NIH funded 328 of these awards in FY 2018. An IC likely saw potential with these R01 applications, granting them interim research support via an R56. This “bridge” funding, in turn, allows the innovative research idea to continue and obtain additional data useful to revise the current application.

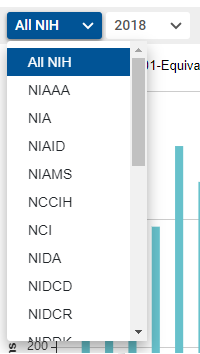
Individual IC-level data are also available for viewing and downloading from the site as well (Figure 3).

We will continue to report these data going forward for the community to better communicate NIH’s funding decisions.


0 Comments